How we actually measure developer productivity
“You can’t measure developer performance.”
We’ve all heard that before. In fact, we used to say it ourselves.
For years, at Pragmatic Coders, we wrestled with this exact problem. Developer work is creative, complex, and varied—how can you possibly reduce it to a metric?
But after many failed attempts, we’ve landed on a simple yet powerful way to measure what matters: delivered value.
It’s not perfect. It took us over a year to implement. But today, it’s a core part of how we build trust, improve our teams, and deliver better outcomes for our clients.
Why It’s So Hard to Measure Developer Work
There’s no shortage of reasons why people say measuring development work is impossible:
“It’s a creative process—you can’t quantify it.”
“If we start measuring, developers will just focus on quantity, not quality.”
“Tasks are too different to compare.”
“Teams vary too much to benchmark.”
And honestly, a lot of historical attempts at measurement have failed. They focused on meaningless metrics (like lines of code) or fostered toxic performance comparisons between developers. The result? Distrust, burnout, and bad software.
But what if we looked at it differently?
A Simple Starting Point: Delivered Value
Let’s keep it pragmatic.
We asked ourselves: What’s the smallest, measurable, consistently deliverable unit that contains business value?
Our answer: a deployed user story.
Is that a perfect outcome? No. But it’s close enough to be useful—if we define “user story” properly, and use supporting metrics to balance the picture.
The Core Metric We Use
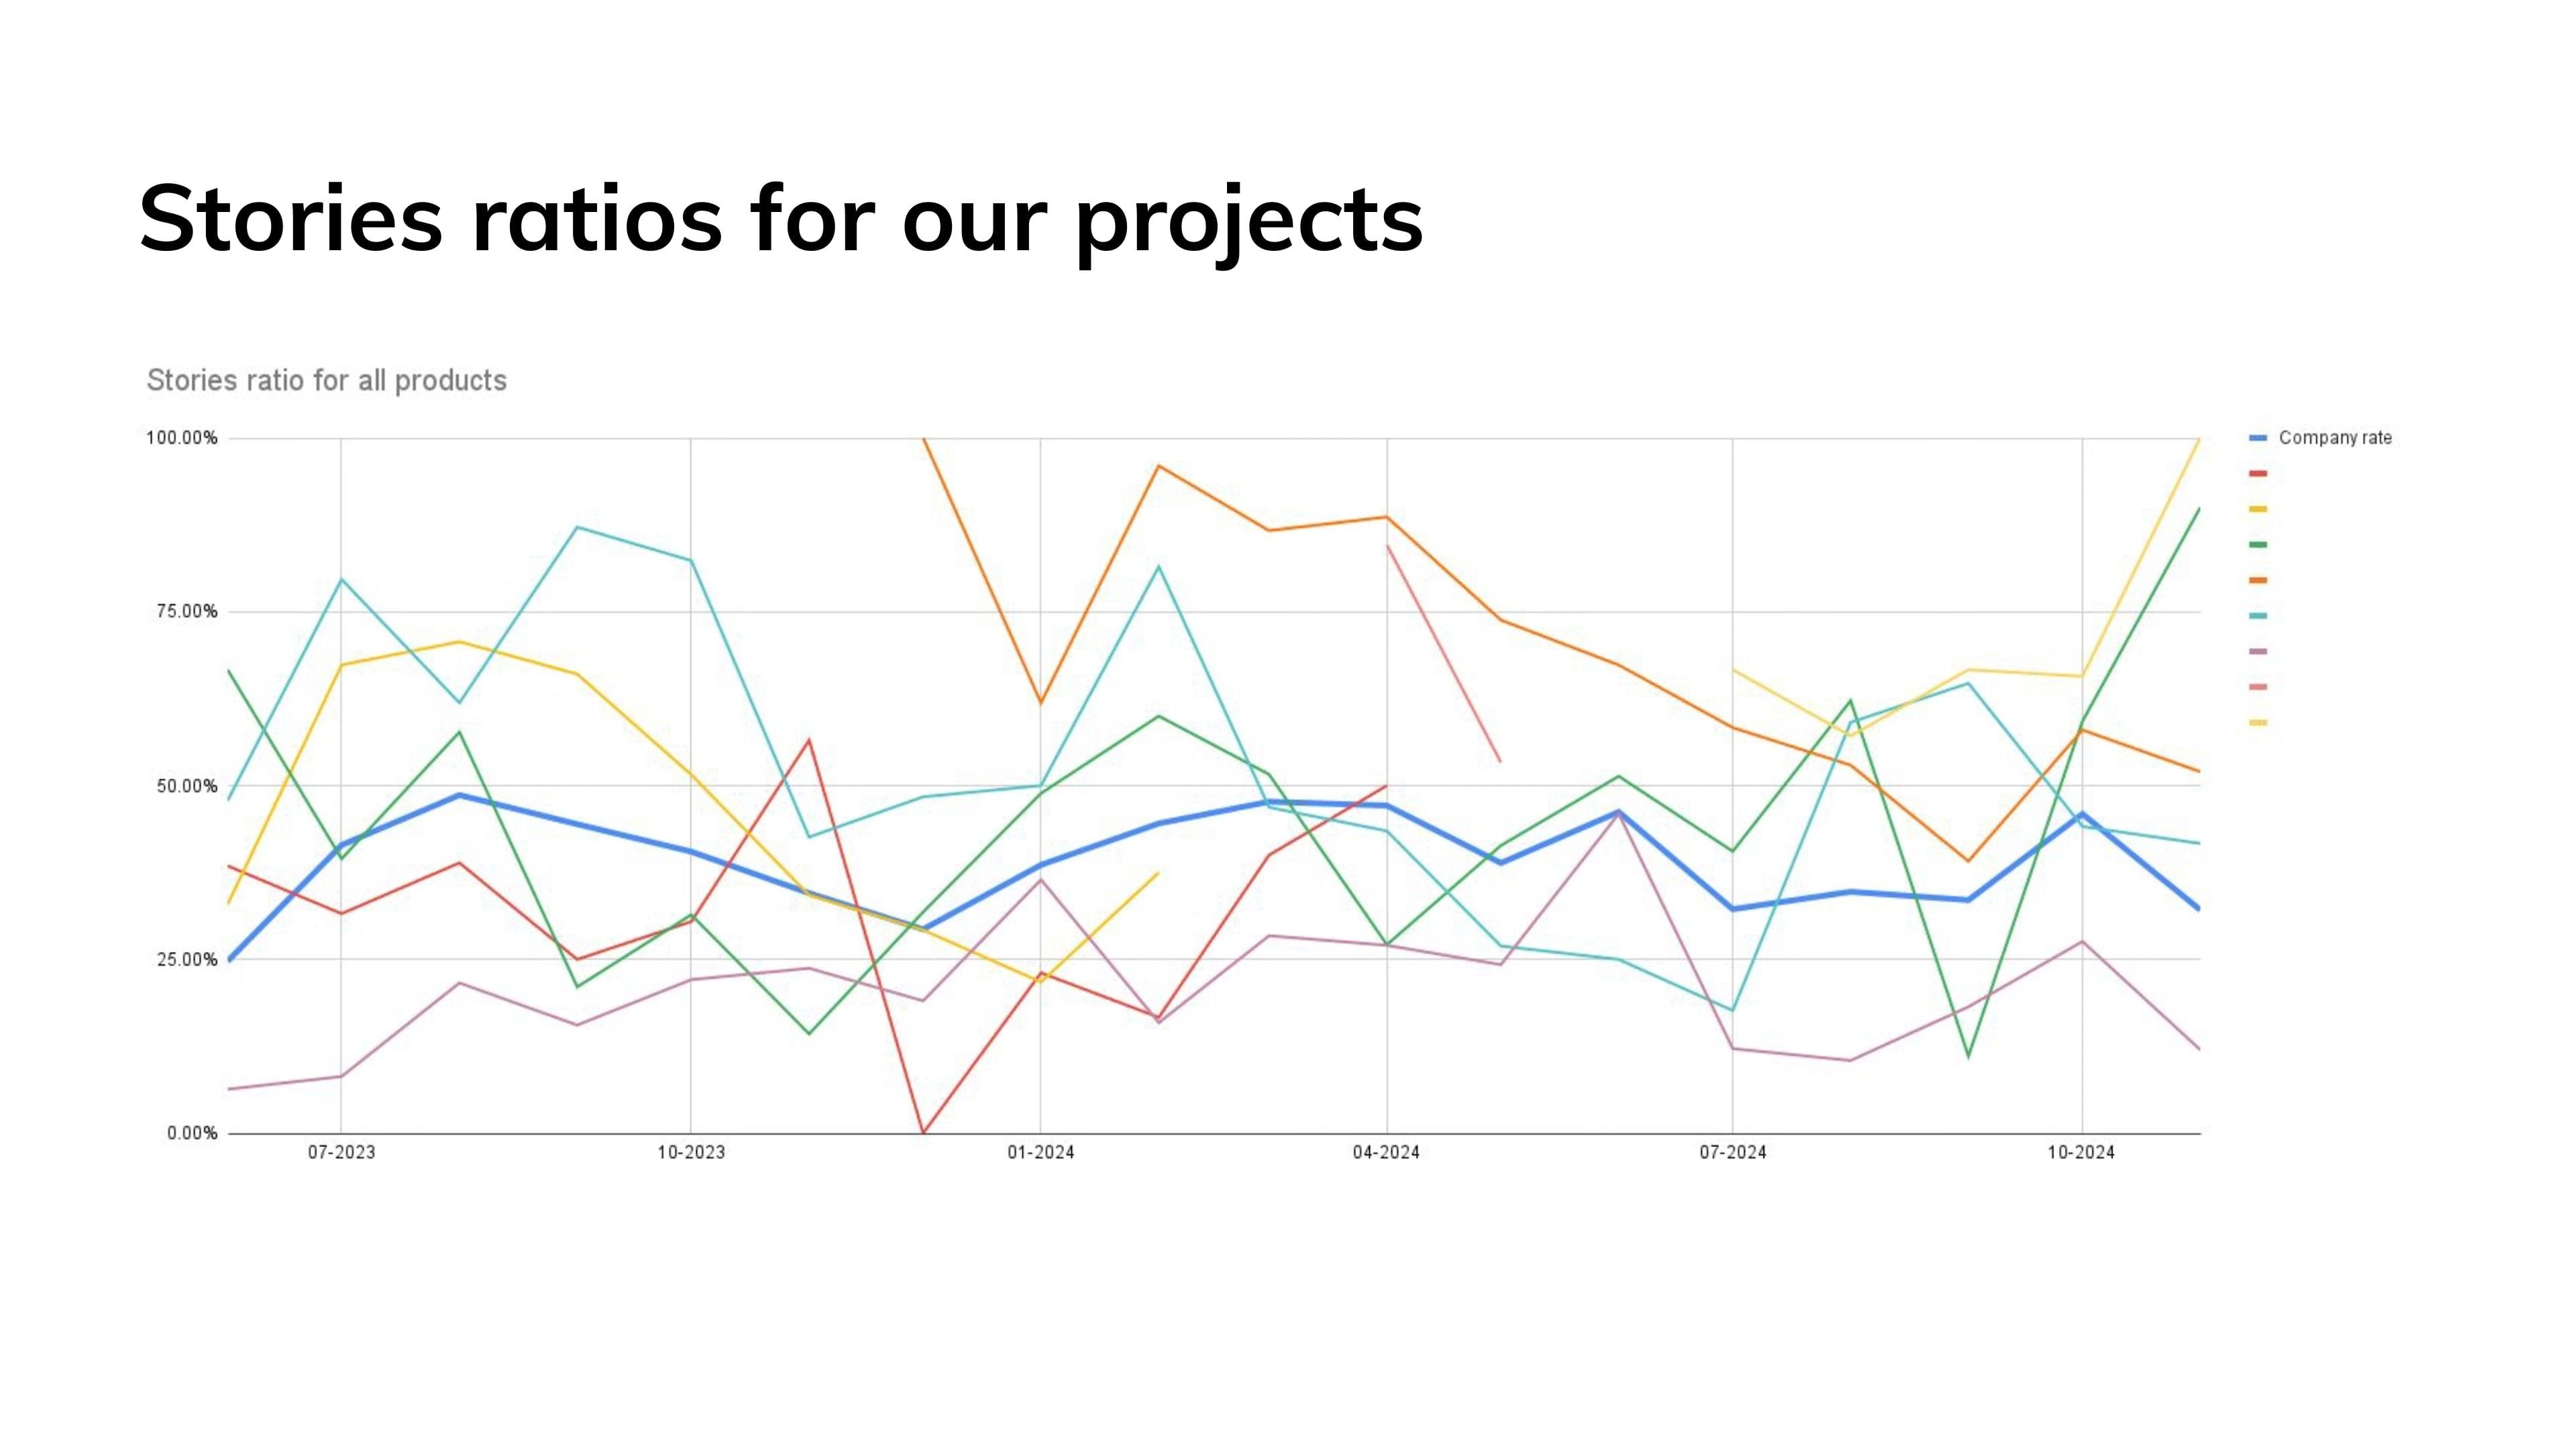
Stories ratios for our projects
We measure:
The average number of hours it takes to deliver one user story to production.
That’s it. In our case, that’s 46.12 h/story (as of the end of 2024). Learn more: Summary of 2024 & plans for 2025 at Pragmatic Coders
And it includes:
All project work (not just devs—also DevOps, product owners, QA, etc.)
Billable hours only (so it’s a real cost metric)
All project phases, not just sprints
We also track:
Average hours per task (including tech debt, bugs, infrastructure)
Bug-to-task ratio over time
Proportion of user stories to total tasks
This combo helps us balance speed, value, and quality—instead of optimizing for just one at the expense of others.
Why It Works (and What It Shows)
Measuring average hours per user story gives us three key advantages:
1. It encourages agility.
Delivering value often is a sign of adaptability. If we deploy stories frequently, we can pivot faster—and clients care more about responsiveness than raw output volume.
As one client put it:
“It’s better to be praised frequently for small wins than remembered for one big failure.”
2. It opens honest conversations.
It’s much easier to talk with clients about business value when we know what it costs—on average—to deliver a story.
Instead of debating vague scope ideas, we can say:
“This story will likely take 50 hours. Is the outcome worth that investment?”
3. It removes obsession with team size.
Larger teams don’t always mean faster delivery.
We compared two teams:
One small, one almost twice the size
Both had similar cost per story
The bigger team delivered more—but cost more too
Result? Cost per unit of value was nearly identical.
But What About Quality?
One common criticism of delivery-focused metrics is that they overlook quality.
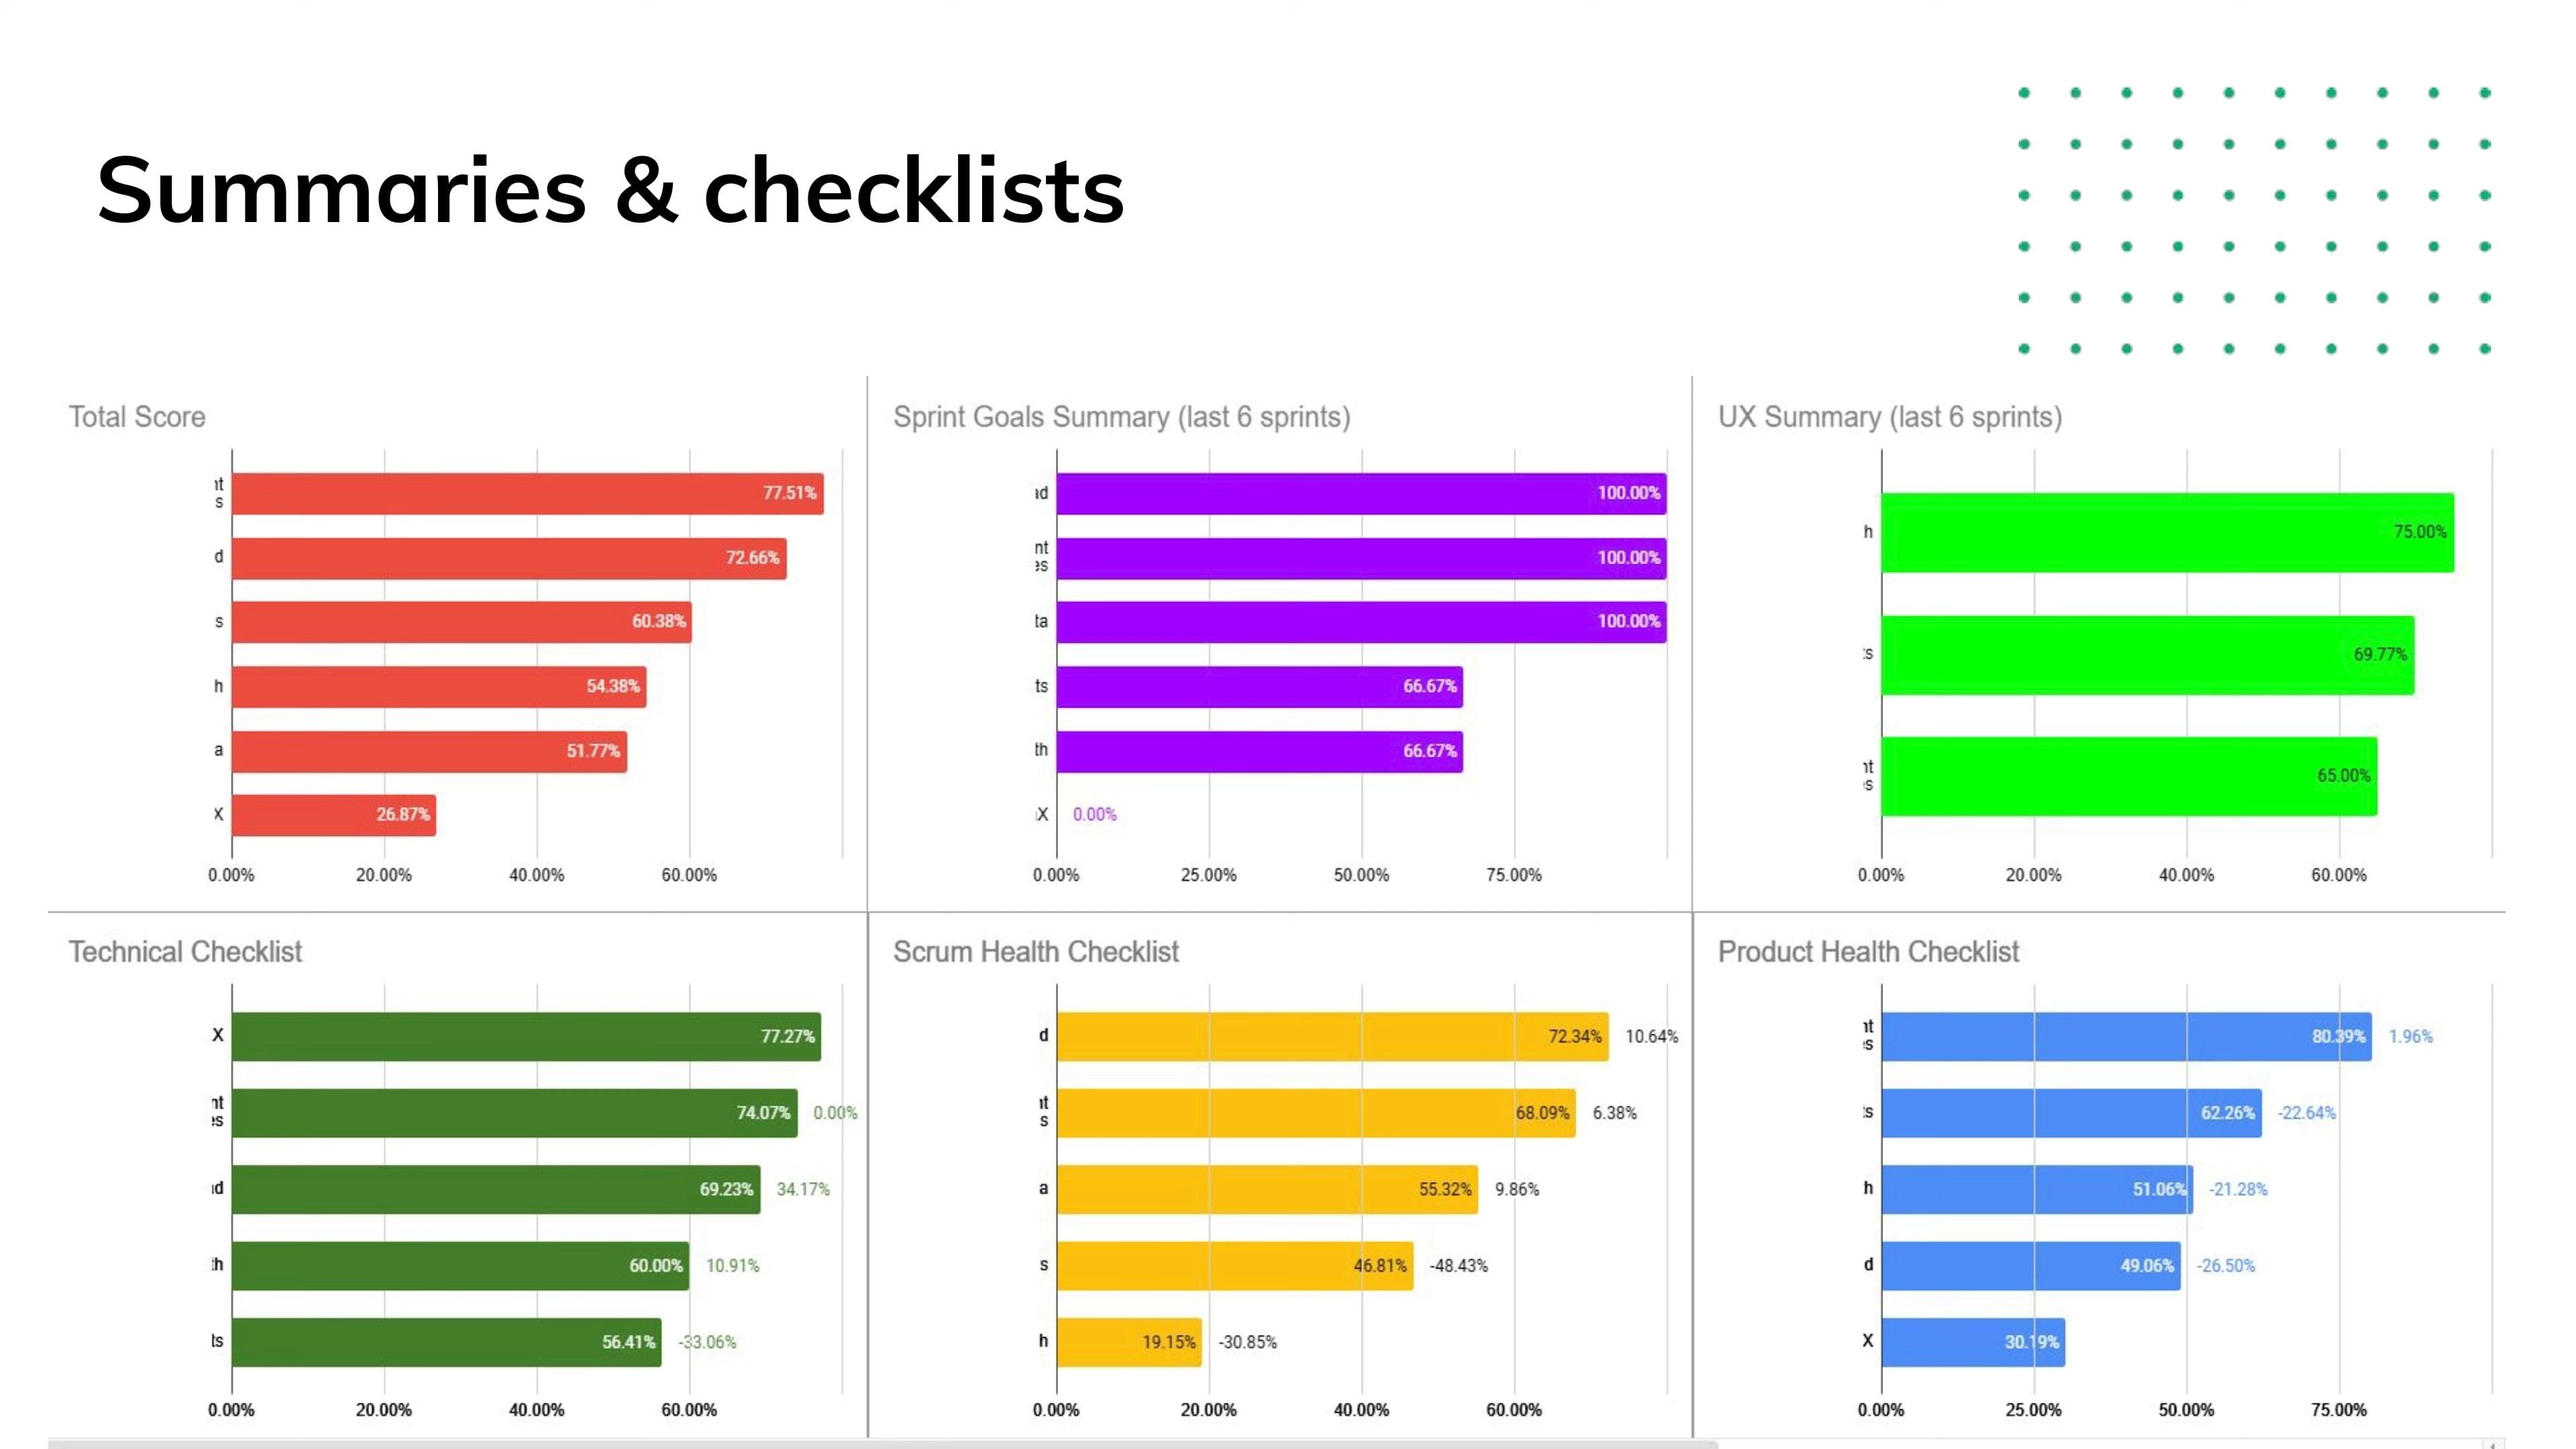
We’ve addressed this with supporting metrics, like:
Percentage of tasks that are bug fixes
Ratio of technical tasks to value tasks
Trendlines over time
On one chart, we showed how a project we took over from another vendor was dominated by technical fixes and bugs—less than 20% of tasks were user stories.
But over time, that ratio improved. Fewer bugs, more value. The visual data made it obvious that quality was rising.
Common Objections—and Our Take
We’ve heard every argument under the sun. Here are a few—and how we respond.
🧠 “User stories vary too much in size!”
Yes—if you only measure a few stories. But with dozens or hundreds of data points, the law of large numbers kicks in.
As we like to say:
“If I walk my dog, we have an average of three legs. Doesn’t mean much, right?”
But with enough data, averages become meaningful. So don’t look at a handful of stories—look at 50, 100, or more.
🔧 “We don’t use stories. We just have tasks.”
We track those too! The key is defining what’s what:
User stories = business value
Tasks = technical work
Bugs = fixes
You need clear definitions. Otherwise, the data will be garbage.
🎯 “Teams will just break stories into smaller pieces to look better.”
Honestly? That’s great.
If your team can split requirements into smaller, valuable chunks that can be shipped more often—that’s agility.
More stories delivered = faster feedback loops = more value.
⚖️ “But isn’t this just optimizing for quantity?”
Only if you ignore quality. That’s why one metric is never enough.
We always pair our core metric with others that reflect:
Bug rates
Technical task load
Legacy code indicators
If those start creeping up, we intervene.
Implementation: It Took Time
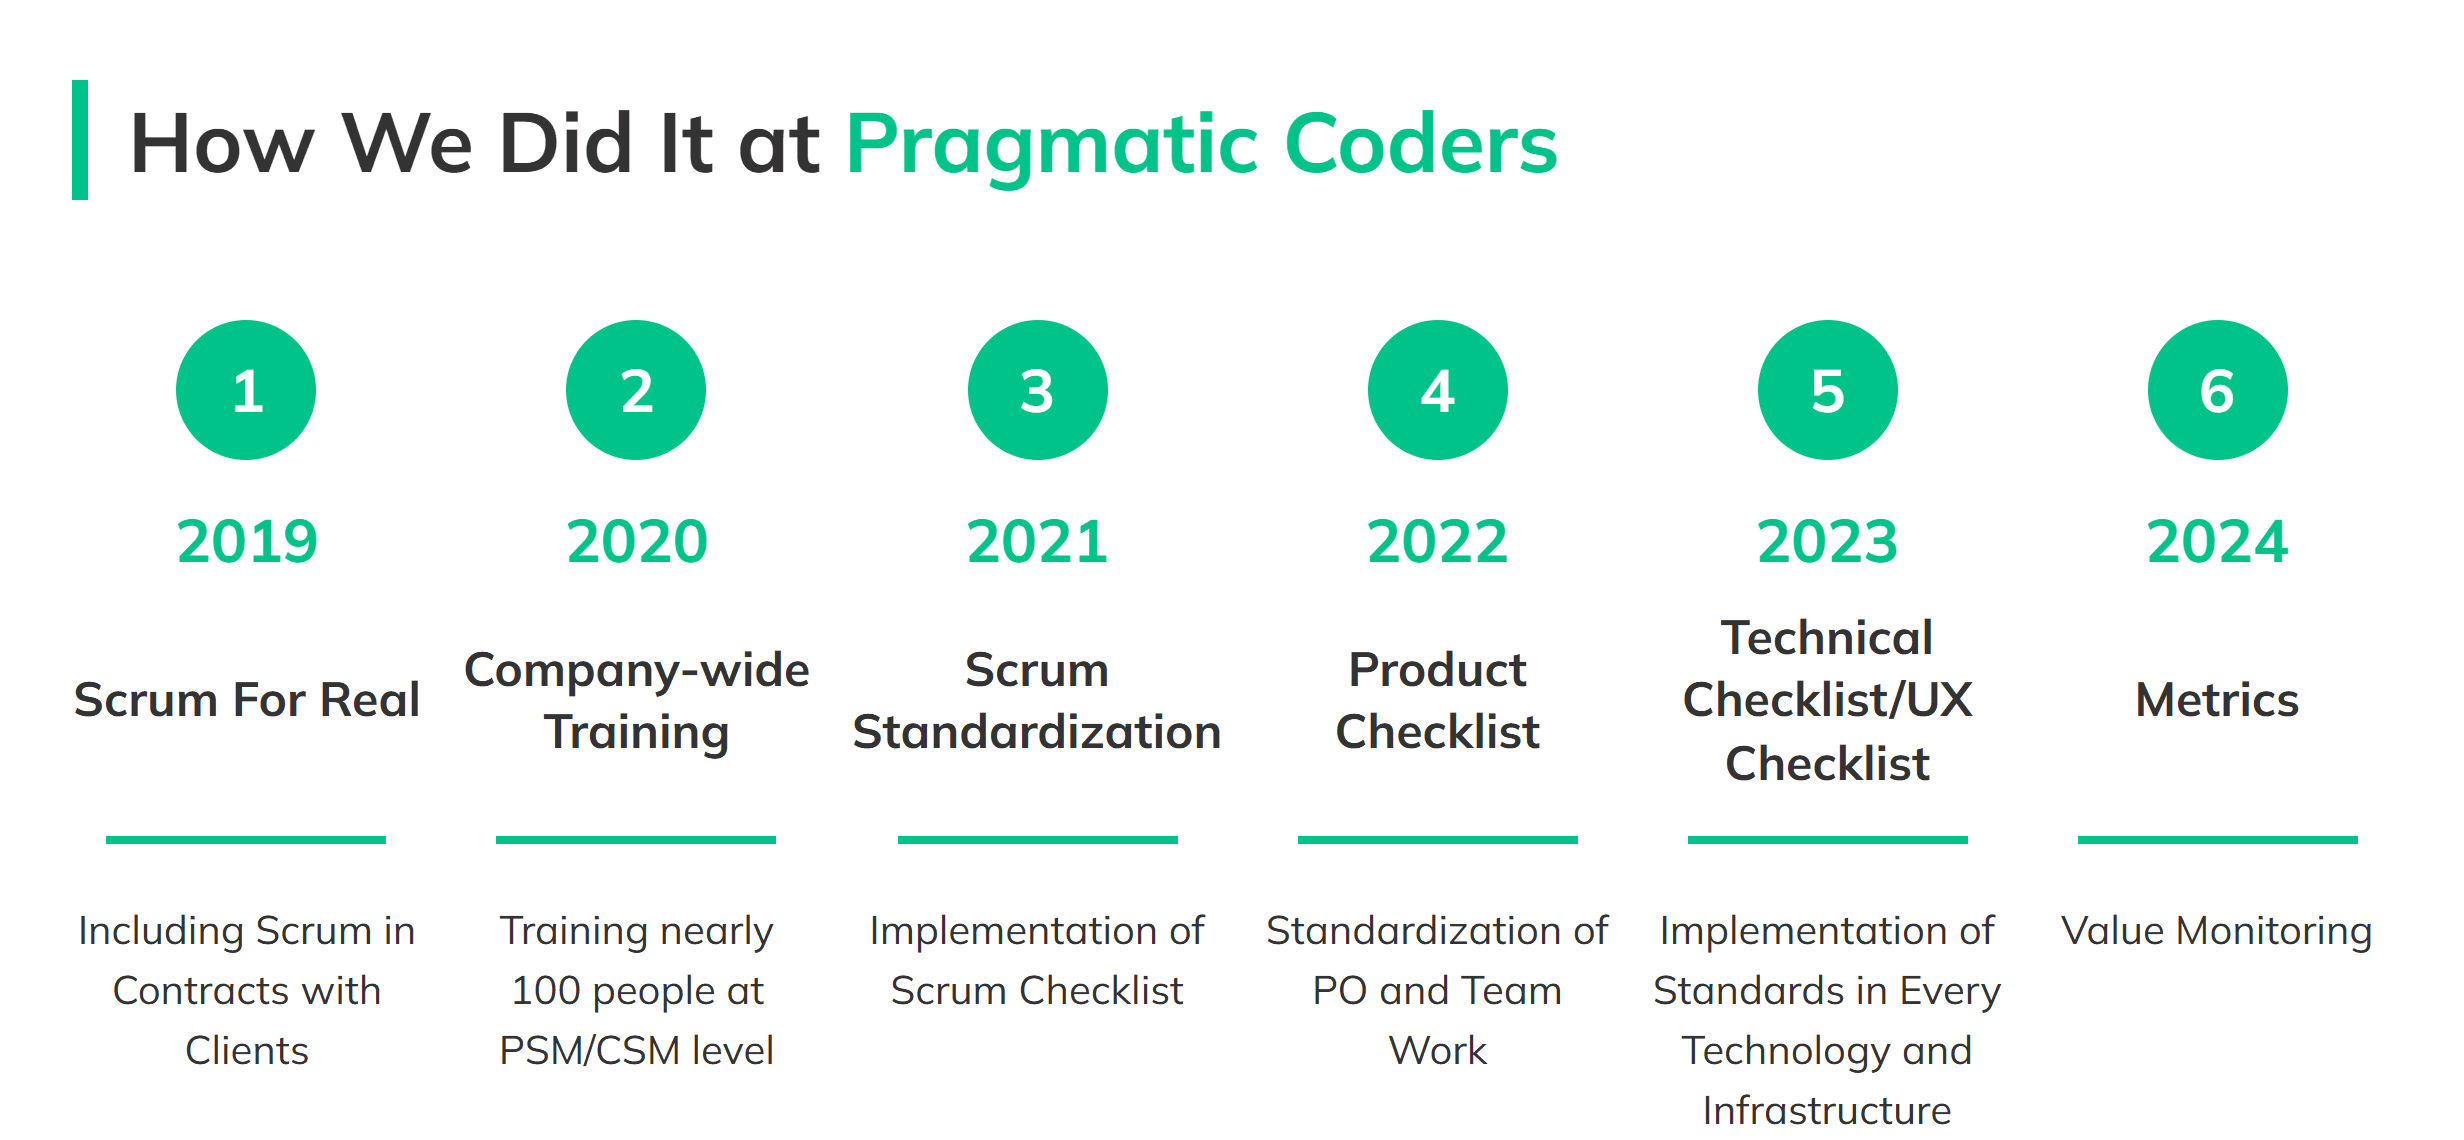
Checklists at Pragmatic Coders
Let’s be clear: this didn’t happen overnight. It took us months—maybe over a year—to fully roll it out.
What made it work?
Standard definitions across the company
Checklists and shared language (you can download our Product Health Checklist HERE).
Training for new hires and existing teams
Continuous feedback from every team
Everyone contributes to refining the system. These metrics aren’t enforced top-down—they’re co-created.
That’s why people trust them.
Bonus: Estimating New Projects
One added benefit: we can estimate new projects with surprising accuracy.
If we know the average cost per story, and we can break down a project into user stories, we can make early ballpark estimates that are:
Clear
Honest
Evidence-based
And it helps us push back when a client proposes something with unclear or low outcome. We can say:
“That’ll cost 80 hours. Are you sure it’s worth it?”
Final Thoughts
This isn’t a magic formula. It’s just what works for us.
But if you’re struggling to measure team performance in a way that aligns with agile values, business outcomes, and team trust—this could be a good starting point.
Don’t measure people. Measure value.
Define it clearly. Track it honestly. And always use more than one lens.
If you’re curious about how this might work in your company, drop us a message—we’re always happy to talk.

Article author
Article co-author